Vibration detection capabilities were discovered by accident one day in the lab. A centrifugal mixer was vibrating excessively and we had the idea to see if Smartfoam could measure it. Read this article to learn more.
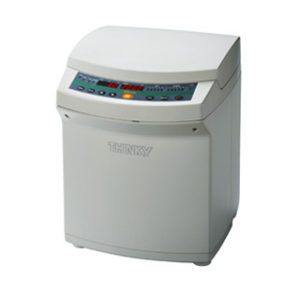
Centrifugal mixer testing setup. All data was gathered from sensor in lower-left corner. Validation was performed with a triaxial
accelerometer mounted directly above it.
Smartfoam powered bushings designed for vibration detection to predict mechanical failure are possible now. By replacing existing bushings in cars, planes, satellites, and rockets with smart, vibration detection, bushings, we can monitor motion and vibration in ways never before possible. XOnano technology will enable you to detect early warning signs of failure or signs that maintenance is necessary.
NASA has expressed interest in XOnano’s ability to measure and sense vibrations. XOnano bushings have the ability to test and measure vibrations in real time thereby providing information that saves equipment or even lives.
Vibration detection analysis from a centrifugal mixer with a Smartfoam bushing on of the feet.
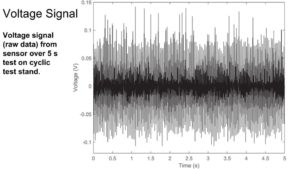
Voltage signal (raw data) from sensor over 5s test on cyclic test stand.
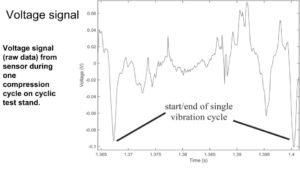
Voltage signal (raw data) from sensor during one compression cycle on cyclic test stand.
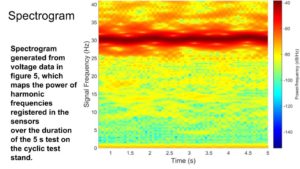
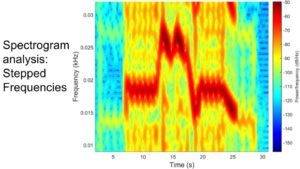
Spectrogram generated from voltage data, in which maps the power of harmonic frequencies registered in the sensors over the duration of the 5s test on the cyclic test stand.
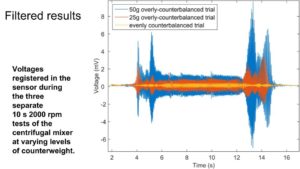
Voltages registered in the sensor during the three separate 10s 2000 rpm tests of the centrifugal mixer at varying levels of counterweight. This data was filtered with a 6th order low-pass Butterworth filter (cutoff frequency of 43 Hz).
Spectrogram and corresponding strongest harmonic plot of 50g over-counterbalanced, 10s, 2000 rpm trial of centrifugal
mixer. The data used to generate this spectrogram is the raw data.
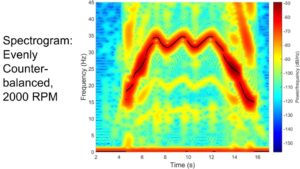
Spectrogram and corresponding strongest harmonic plot (disregarding very low frequencies) of evenly-counterbalanced, 10 s, 2000 rpm trial of centrifugal mixer. This data was filtered with a 6th order low-pass Butterworth filter (cutoff frequency of 60 Hz) before generating this spectrogram.